Module 6 Handling data
Select each tab to find out more or use the breadcrumb trail to go to another part of this resource.
Can I explain what different diagrams and graphs represent, read information from them and draw conclusions from this information?

Example review questions

  • This graph shows the temperature of a liquid as it cools.
    Graph showing temperature in centigrade on the Y axis and time in minutes on the X axis.
    How many minutes does it take to reach 40°C? For how many minutes is the temperature above 60°C?
  • This bar graph shows responses from Year 6 pupils about whether they would buy a magazine.
    Bar chart showing responses of Year 6 girls and boys on buying magazines.
    Amy says it shows that boys are less likely to buy the magazine than girls. Is she right? Explain your answer.

Teaching guidance

This teaching guidance document suggests some of the key vocabulary, models, images and practical equipment that children should experience and be able to use. It also includes some teaching tips to provide a few starting points for ways of supporting children with this area of mathematics.

PDF file Teaching guidance: Can I explain what different diagrams and graphs represent, read information from them and draw conclusions from this information? | 209KB new window

Consolidation and practice

These resources are to support children in guided or independent work. Roll over the highlighted resources for a description.
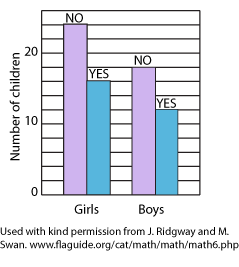
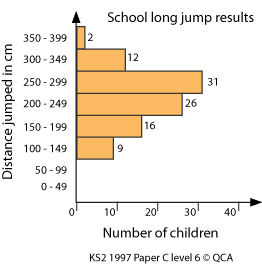
Data handling

itp_data_handling.png

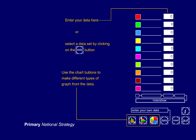
This interactive teaching program (ITP) is an ICT-based tool to support the exploration of data. Data handling ITP allows the child or teacher to enter data into a table and then create a vertical bar chart, a horizontal bar chart or a pie chart. The user can select from existing datasets, which can then be amended to show the impact and change on the charts, or they can enter collected data.
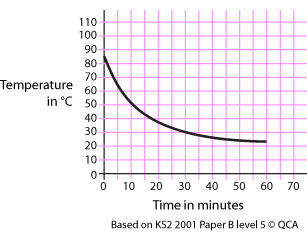
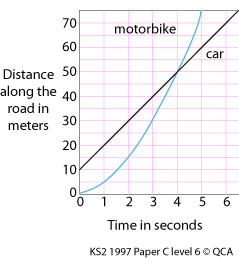
Line graph

itp_line_graph.png

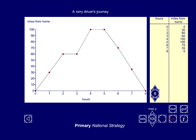
This interactive teaching program (ITP) is an ICT-based tool to support the exploration of handling data. Line graph ITP allows the child or teacher to enter data into a table or select from existing data sets and then create a line graph to represent the data. Data and values on axes can be changed to explore the impact on the graph.

Opportunities to use and apply

Possible contexts include:

  • Exploring issues in school, e.g. graphs created to explore issues that may support School Council decisions, such as homework.
  • Real-life graphs and charts, e.g. from newspapers, magazines and websites.
  • Cross-curricular contexts, e.g. line graphs produced in science experiments; real-life data linked to geography and history projects.
  • Measures, e.g. conversion graphs - create and interpret line graphs to show the relationship between linked measures, such as comparing pounds with euros, converting Celsius to Fahrenheit.

Confirming learning

  • A car and a motorbike drive along the same road. This line graph shows details of their journey.
    What can you say about the car and the motorbike at the point that their lines cross on the graph?
    Compare the journeys of the two vehicles using the information from the graph.
    Graph showing the journey of a motorbike and car showing distance along the road in meters on the Y axis, and time in seconds on the X axis.

Graph showing school long jump results, with distance jumped in centimetres on the Y axis and number of children on the X axis.

  • Here are the long jump results for a school. They are measured to the nearest centimetre. Steve jumped 315 cm. He says 'Only 2 people jumped further than me.' Could he be correct? Explain your answer.