Module 6 Handling data
Select each tab to find out more or use the breadcrumb trail to go to another part of this resource.
Can I sort and interpret data in Venn and Carroll diagrams?

Example review questions

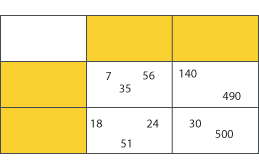
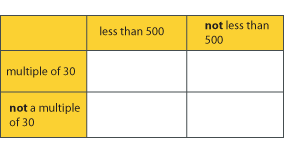
  • Write one number in each of the white sections of the diagram.
  • Put these numbers in the correct sections.
    60, 742, 1180, 390, 530
  • Describe the numbers that could go in each of the white sections.
A Carroll diagram. Two columns, two rows. Row one: multiple of 30. Row two: not a multiple of 30. Column one: less than 500. Column two: not less than 500.

Teaching guidance

This teaching guidance document suggests some of the key vocabulary, models, images and practical equipment that children should experience and be able to use. It also includes some teaching tips to provide a few starting points for ways of supporting children with this area of mathematics.

PDF file Can I sort and interpret data in Venn and Carroll diagrams? - teaching guidance | 25KB new window

Opportunities to use and apply

Possible contexts include:

  • classifying materials, animals or plants according to two different criteria in science lessons;
  • comparing and sorting different localities according to chosen characteristics, in geography lessons;
  • investigating the properties of numbers or shapes;
  • analysing data collected about the school or class.

Confirming learning

Ask probing questions such as:

  • On the sorting diagram, numbers have been placed in the white sections. What labels might have been in the yellow sections? Can you find any alternatives?
  • Using your labels, add two new numbers to each section.
  • Are there numbers that wouldn’t fit in any section? Why?
  • Now represent the information in your Carroll diagram as a Venn diagram.
A Carroll diagram without labels, but populated with numbers. Row 1, column 1: seven, 35, 56. Row 2, column 1: 18, 24, 51. Row 1, column 2: 140, 490. Row 2, column 2: 30, 500.