Teaching guidance
This teaching guidance document suggests some of the key vocabulary, models, images and practical equipment that children should experience and be able to use. It also includes some teaching tips to provide a few starting points for ways of supporting children with this area of mathematics.
 Can I use_data_to_answer_a_question? - teaching guidance | 220KB
Consolidation and practice
These resources are to support children in guided or independent work. Roll over the highlighted resource for a description.
Data handling
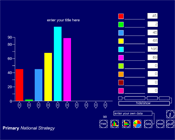
This interactive teaching program (ITP) is an ICT-based tool to support the exploration of data. Data handling ITP allows the child or teacher to enter data into a table and then create a vertical bar chart, a horizontal bar chart or a pie chart. The user can select from existing datasets, which can then be amended to show the impact and change on the charts, or they can enter collected data.
Opportunities to use and apply
Possible contexts include:
- science, e.g. Moving and growing. Suggest measurements to take to answer questions such as: ‘Who has the greatest hand span?’ Choose how to present the results.
- geography, e.g. Looking at temperature graphs to investigate weather around the world, or use data to investigate how much rubbish we throw away in the school grounds.
- PE, e.g. Find out what sport your class prefers. Explain what you would do to answer this question. How would you record and present the information?
Confirming learning
Ask probing questions such as:
- How could you use data to find out whether it’s true that most children in Year 4 have blue eyes? How might the data be represented?
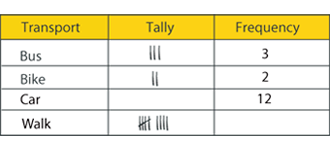
- When might a tally chart be useful? Can you think of an example and explain why is it useful?
- When might a bar chart be useful? Can you think of an example and explain why is it useful?
- Show the children some data. Ask them to discuss some questions the data can be used to answer.
 Handling data