Consolidation and practice
These resources are to support children in guided or independent work.
Calculating angles
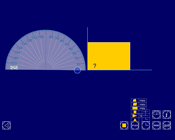
This interactive teaching program (ITP) is an ICT-based tool to support the exploration of angles. Calculating angles ITP allows the child or teacher to represent single or multiple shapes rotated around a central point in one, two or four quadrants. The size of angles can be estimated or calculated and confirmed using the on-screen protractor or reveal function.
Polygon
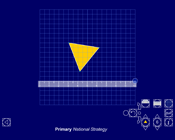
This interactive teaching program (ITP) is an ICT-based tool to support the exploration of shape, space and measure. Polygon ITP allows the child or teacher to represent regular polygons with three to ten sides. The ITP can then be used to explore the properties of regular and irregular shapes by dragging vertices and creating additional vertices. The ITP includes an on-screen protractor and ruler.
Fixing points
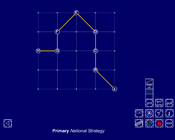
This interactive teaching program (ITP) is an ICT-based tool to support the exploration of shape and space. Fixing points ITP allows the child or teacher to create one or more shapes by connecting a number of vertices on a grid. Angles can be estimated and measured, and the effect of moving different vertices can be explored.
Opportunities to use and apply
Possible contexts include:
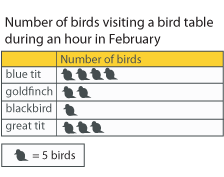
- science, e.g.
- What can you say about the birds visiting this garden?
- How would you start to find out which are the common birds in your garden and how would you share your findings?
- geography, e.g. Involve children in a pedestrian traffic count in one corridor at different times of the school day. Ask children to present their data as a pictogram showing the time of day and the number of people counted.
Confirming learning
Ask probing questions such as:
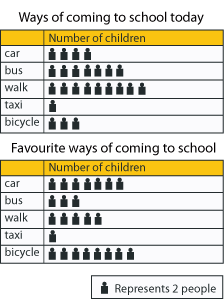
- This pictogram shows the numbers of books that have been read by different reading groups. Jo said the Spiders group read 14 books. Can she be correct?
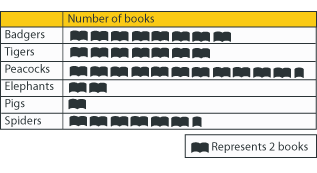
- How would you redraw the pictogram so that each symbol represents four books? Can you redraw the pictogram using a symbol for five books? Which is the easier pictogram to interpret?
 Handling data